Weekly Overview (28 July – 1 August 2025)
Nifty Realty continued its corrective phase, closing the week with a sharp ~5% decline, finishing near 950.60. This marks one of the steepest weekly pullbacks for the sector in Q2–Q3 FY25.
| Date | Open | Close | % Change |
|---|---|---|---|
| 28 Jul | 945.10 | 946.05 | –4.07% |
| 29–31 Jul | ~946 | ~910 | Progressive slide |
| 1 Aug | — | 950.60 | — |
Stock-Wise Performance
Top Gainers:
- Raymond Realty: Showed resilience mid-week
- Brigade Enterprises: Marginal outperformance amid broad sell-off
Top Laggards:
- Godrej Properties: –5.3% to –5.6%
- DLF: –4.7%
- Lodha Developers (Macrotech): –5.9%
- Prestige, Sobha, Oberoi Realty: –3% to –7%
The sharp losses across major realty names led to a market cap wipeout worth several thousand crores, confirming sectoral weakness.
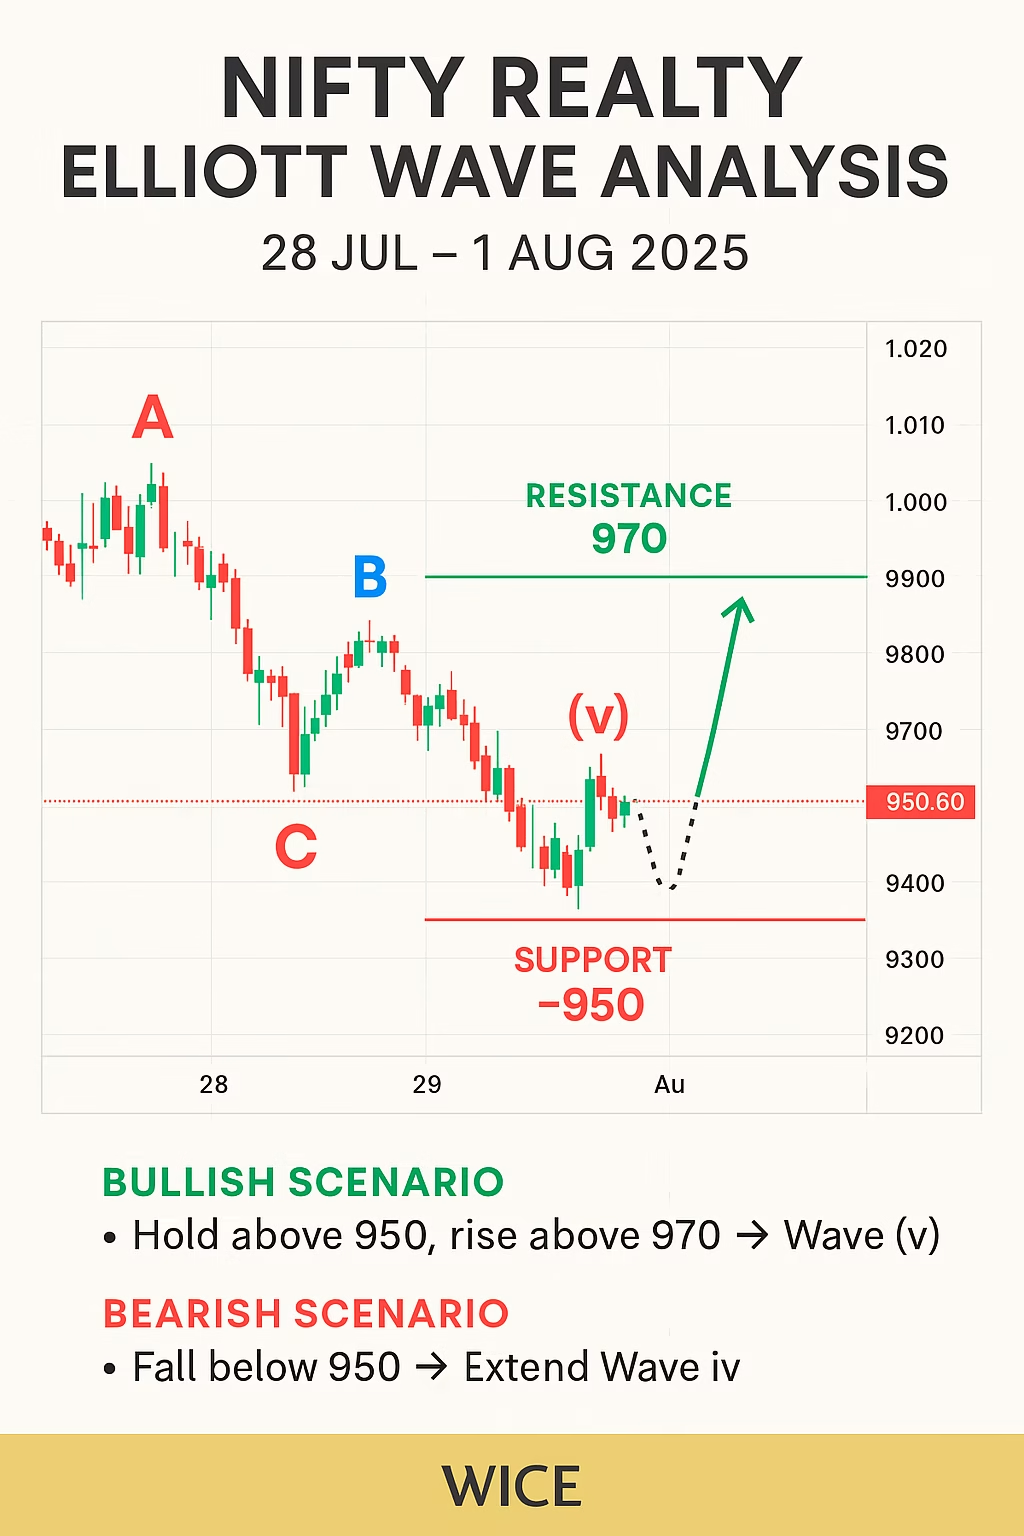
Elliott Wave Structure
- A clear ABC correction was observed during the week.
- This extends the Wave IV structure, breaking below prior support at 960.
- Current structure suggests Wave (v) may initiate soon if support holds at 950.
Outlook: 4–8 August 2025
Bullish Scenario:
- Holding above 950 and reclaiming 970 confirms start of Wave V.
- Price targets: 970–985, then 1,005+
Bearish Scenario:
- A breakdown below 950 implies Wave IV continuation.
- Support levels to watch: 940 and 930
Indicators to Monitor:
- RSI holding above 40
- MACD crossover for early trend reversal
- Stock leaders: Raymond & Brigade to lead bounce if bullish momentum resumes
Infographic Summary
- Weekly drop: –5.0%
- Key zones: Resistance at 970, support near 950
- ABC correction visually confirmed on 30-min candlestick chart
- Scenarios mapped for next week with upward/downward paths
Disclaimer
This analysis is for educational purposes only and must not be construed as financial advice. Markets carry inherent risks. Consult your certified financial advisor before making investment decisions.