123 BHK

Elliott Wave Analysis — Nifty Realty (04 Aug 2025 to 08 Aug 2025): C-Wave Unfolds — What Next?

Elliott Wave Analysis: Nifty Realty (4–8 August 2025) & Outlook for Next Week

Disclaimer

This article is for educational purposes only and is not investment advice. We are not registered with SEBI as investment advisors. Market investments are subject to risks, and you should consult your financial advisor before making any investment decisions.

Week in Review (4–8 August 2025)

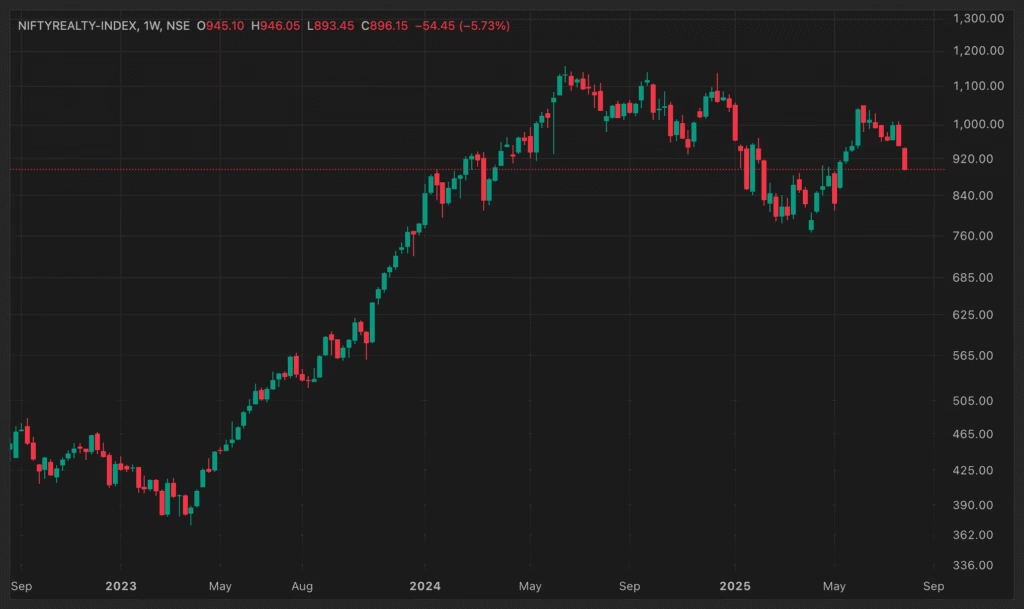
  • The index began the week with a modest gain—opening near ₹912.05 on 4 August and peaking at ₹914.50—only to decline as bearish sentiment took over. It ended the week at ₹874.15, down around 2.11%
  • Intraday swings were notable:
    • 5 August: High of ₹915.75, low of ₹898.35.
    • 6 August: Dropped from ₹908.75 to ₹883.80.
    • 7 August: Range between ₹896.45 and ₹879.20.
    • 8 August: Dropped to a low of ₹871.40, closing at ₹874.15

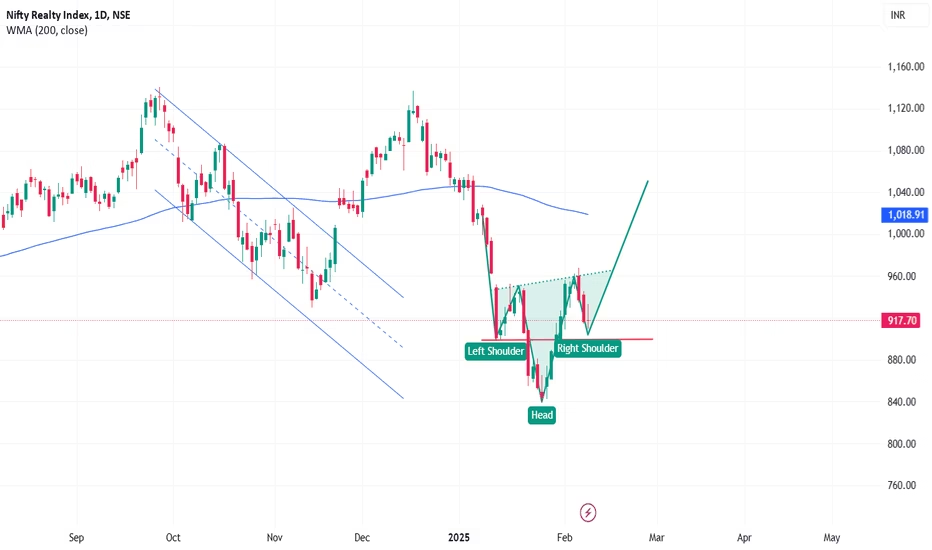
Elliott Wave Mapping

  • Wave 1 – Bearish Impulse: The sharp decline from ~₹915 to ~₹887–894 likely marks the first bearish impulse down.
  • Wave 2 – Weak Corrective Bounce: A feeble retracement near ~₹896 suggests a shallow corrective phase.
  • Wave 3 – Potential Downturn: The slide into ~₹871 could signal the start of a more aggressive decline typical of Wave 3.

Key Support & Resistance Zones

  • Support:
  • Resistance (Correction zone):
    • ₹896–900 zone; a break above this area could challenge the bearish wave structure.

Nifty Realty ETF Snapshot

Forward Outlook: Week of 11–15 August 2025

ScenarioTrigger LevelExpected Movement
Bullish ReboundBreak above ₹896Relief rally toward ₹915–925
Bearish ContinuationDrop below ₹871Sharp downside likely toward ₹800s
  • Strategy Insight:
    • Bullish setup: If index holds above ₹880–887 and shows strength, it could indicate extended corrective action (Wave 2).
    • Bearish risk: Sustained weakness below ₹871, especially on higher volume, could confirm Wave 3 descent.

Summary Table

PeriodElliott Wave StageKey LevelsImplication
4–8 August 2025Wave 1 → Weak Wave 2Resistance: ₹896–900Weak bounce; bearish bias remains
11–15 August 2025Potential Wave 3 (or extended Wave 2)Breakdown below ₹871 / Rally above ₹896Guide for next directional move

Compare